Solvtech, Inc. » Case Studies » SKF / Chicago Rawhide Vendor Managed Inventory (VMI) » Statistics Part Performance
Vendor Managed Inventory (VMI) Tour
 click to enlarge |
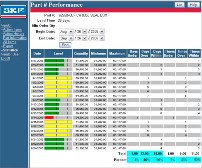
Statistics Part PerformanceThe charts clearly show the percentage of time each part has been within, under and over inventory limits during hte specified time period. Green is within, red is under limit, yellow is over limit. |
| Back | Next |